The curious case of PISA and Suicide.
5th February 2012
I wonder if Michael Gove’s rhetoric would be so laden with references to the importance of emulating countries with high PISA scores if he realised that (as far as I can tell), no PISA country achieves higher scores without also having a higher suicide rate.
Two weeks ago I was listening to Ulrika Jonnson on Broadcasting House. She and the other guests were talking about how happy in their skin people in Sweden seemed to be. That certainly rang true of my observations during a research visit their last year, but there was something that had perplexed me back then and which perplexed me again that Sunday morning. I had often heard it said that Sweden had a particularly high suicide rate. So this time I fired up Wikipedia and checked out the international suicide league table (happy Sunday morning reading). Sweden was in fact relatively low (30th), but there was something familiar about several of the top countries: South Korea, China, Japan and Finland. Hadn’t I seen them in another league table? I couldn’t help myself – I got out my PISA table and logged on to the WHO website to find countries’ suicide rates. I quickly compiled a spread-sheet and generated a couple of graphs by grouping the countries into reading score deciles.
Pause there. Before I go any further- a few of things to make clear.
– This is not about causation.
– I do not think that education causes suicide
– I do not think that countries’ education policies are causing suicide
Now we’ve got that clear, here we go – this is the first graph I got based on reading scores:
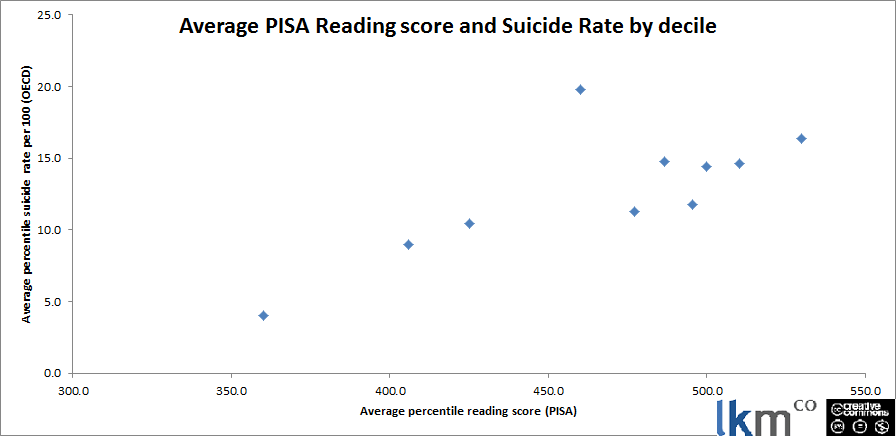 No real reason to choose reading though so let’s plot ‘em all.
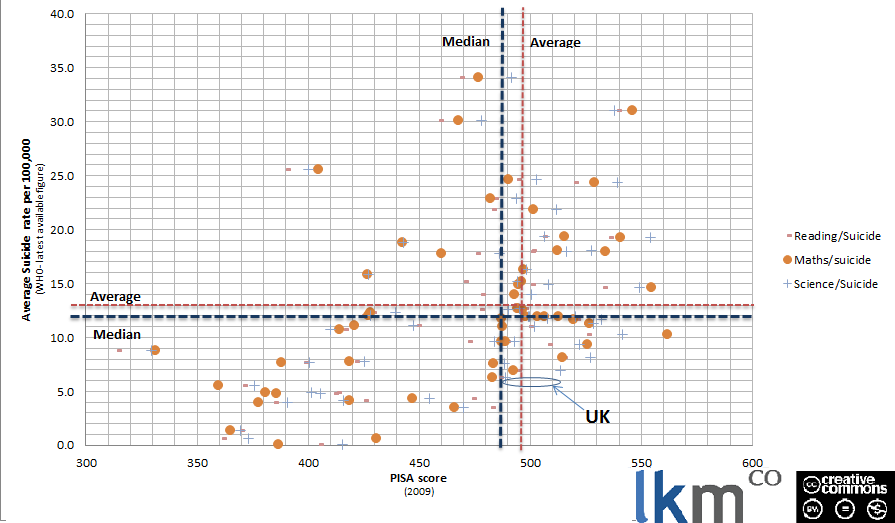 Here’s where I realised that if you go any further to the right from the UK along the PISA axis, all the dots appear to be higher up too. So no country is getting higher PISA scores without having a higher suicide rate too….? Bizarre!
I then wondered what happened if you excluded two big outliers- Russia and Lithuania which had particularly extreme rates. An even tidier line emerged.
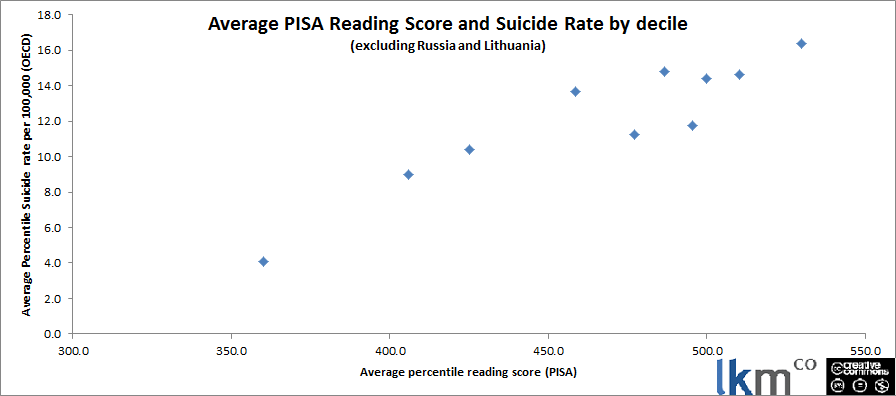 It really is quite striking. But what of it?
Well I’ve spoken about this now to quite a few people who’ve all made interesting observations (thanks to @our_frank, @xtophercook, @miss_mcinerney, @jr_climbing and @jeevanvasgayar). A whole range of issues make this data pretty sketchy:
- Suicide rates are not very stable year on year
- Figures appear to differ in different sources
- Collection of data on suicide varies from country to country (including due to religious issues particularly in Catholic countries)
- The correlation is certainly not strong enough to have any predictive power.
However, it remains an interesting pattern. What could be causing it? Everyone I’ve spoken to has different ideas and I’m sure you will be able to add your own.
- Cultures that value discipline and place importance on not failing
- Religious character
- Gun ownership
Grouping by decile mitigates these factors, since a range of countries is present in each (see full data) but anyway, the point I take from this is that it is an illustration of the dodginess of policy tourism.
Policy tourism looks at a country, picks a desirable characteristic, treats this as an output and then chases whatever inputs are thought to contribute to it… or more cynically, which the tourist already wants to pursue. So we have/(Gove has) picked an output- (scoring well on his three favourite tests- consider the balance between, say, PISA and TIMMS) and then selected a subset of the country’s inputs (See Laura’s excellent blogs on the selective use of international evidence in the education White Paper and Curriculum Review). I wonder what would happen if we selected another output- say low suicide rates, and pursued whatever policies we considered to contribute to these…?
I’m no statistician so do please download and check the data, play with it and tell me what you find out.
One more plug while we’re at it, if you haven’t yet completed our quick survey on perceptions of teaching union, please do. Then we can bring you even more juicy data and you can be part of it!
Comments