Breaking the Link? Attainment, poverty and rural schools
5th April 2019
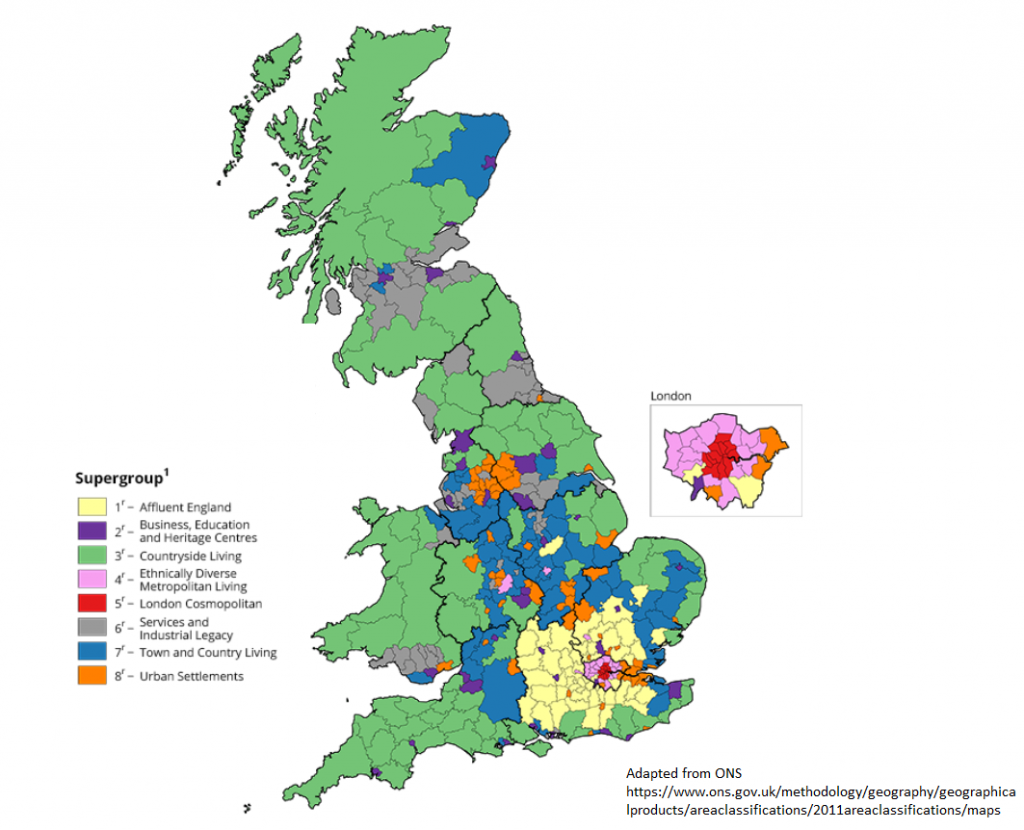
The relationship between disadvantage and attainment varies considerably between different parts of England. Combining datasets shows that poverty has a particularly pernicious effect on educational attainment in some area-types, particularly the rural areas shown in green, below.
Free School Meals aren’t the only ingredient
In recent years there has been increasing recognition that the relationship between deprivation and educational achievement is not as simple as we once thought. Researchers like Simon Burgess have shown that the interaction between disadvantage and ethnicity / migration status, for example, is often underestimated.
At LKMco we’ve had a longstanding interest in ONS area classifcations (see ‘The Two Kingstons – what FSM does and doesn’t tell us’ and ‘Maybe it’s because I’m a Londoner’). These classifications combine a range of characteristics of different areas, including industrial and employment data; demographics and qualification levels.
Combining these classifications with school data reveals striking differences between patterns of school performance in different area types.
Affluent England and London in the lead (surprise, surprise)
At the most basic level, we see that area types differ considerably in their attainment and deprivation levels.
Areas described as ‘Affluent England’ achieve most highly, but ‘London Cosmopolitan’ and ‘Ethnically Diverse Cosmpolitan’ areas are not far behind – despite having two or three-times the same level of deprivation.
However, once we plot FSM levels against attainment, the results get considerably more interesting – and the worrying situation in rural schools is revealed.
A variable picture
Firstly, notice how apart from a small cluster of very-low-deprivation, very-high-attainment schools on the far left, pink dots dominate the top of the distribution. These represent ‘ethnically diverse cosmopolitan’ areas (most of which are in Greater London). This shows that regardless of their deprivation levels, pupil tend to do best in these areas. Meanwhile, red dots are concentrated in the top right-hand corner. These represent high-achieving, high-deprivation central-London schools.
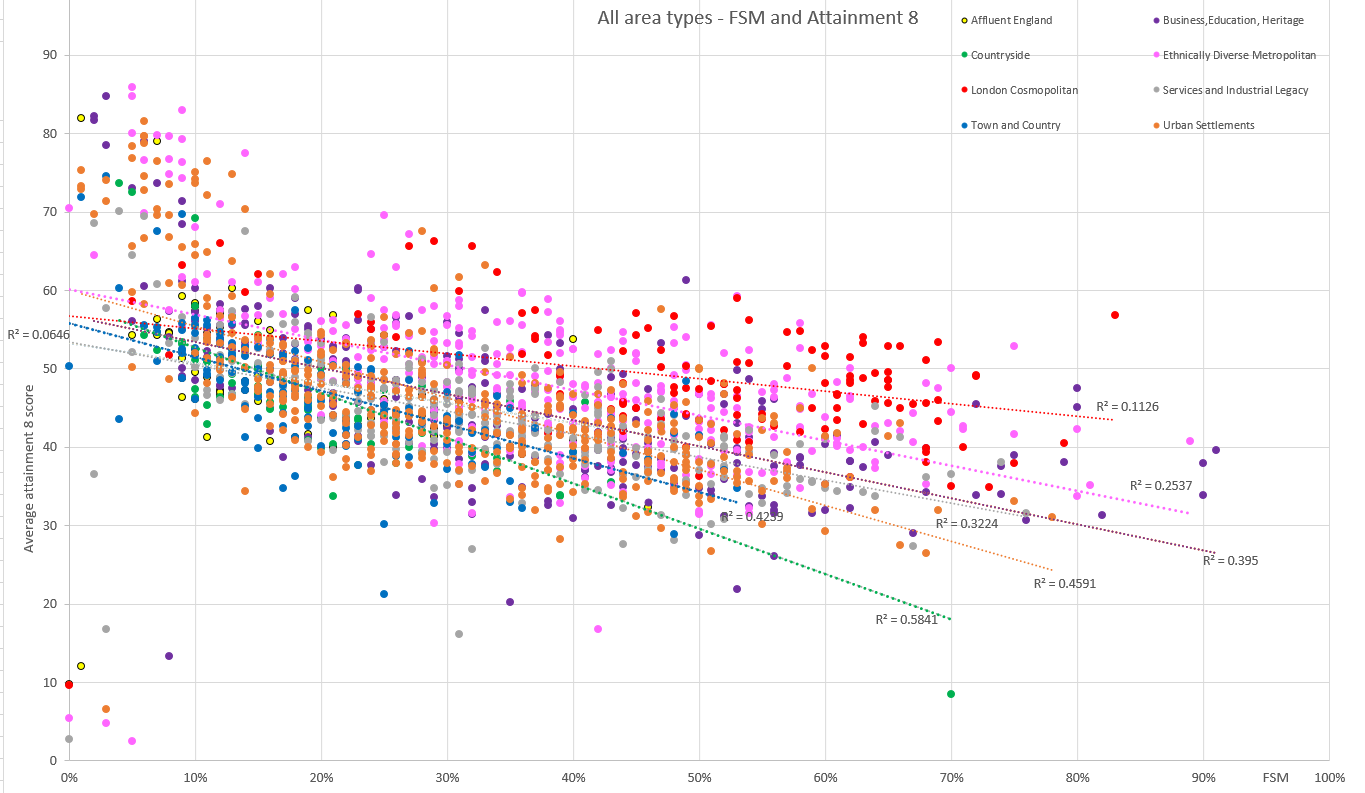
How strong is the link between deprivation and attainment…? It depends on the area
Switching our attention to the trend lines and R-squared values (representing the strength of the relationship between poverty and attainment), we see that the angle of the lines differs considerably – as does the strength of the correlation, even though all eight correlations are significant.
Notably, in rural areas the relationship between poverty and educational outcomes is particularly strong. So although pupils in rural schools with low deprivation attain highly, schools in deprived areas are really struggling.
Rural schools have particular difficulty breaking the link between poverty and low pupil attainment. Click To Tweet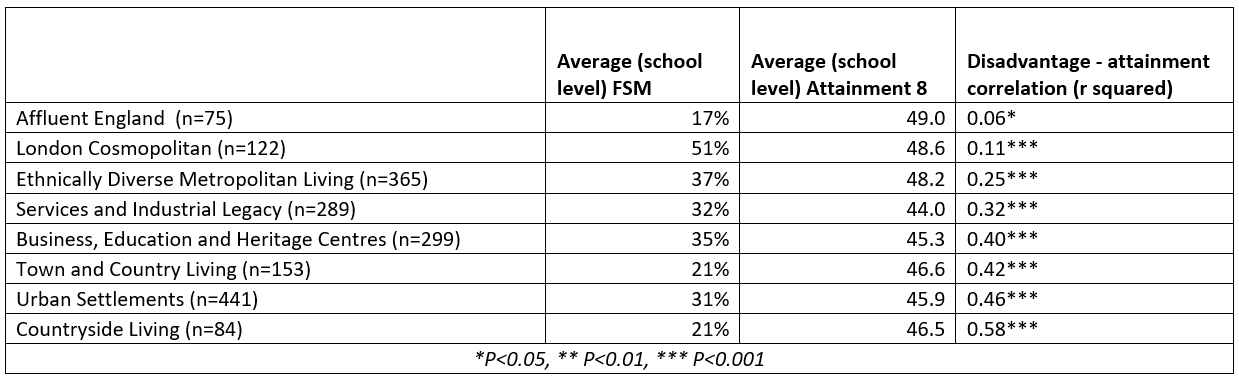
What about pupil progress?
Switching the measure to pupil progress paints an even starker picture of pupil outcomes in disadvantaged rural schools.
In general, the relationship between FSM and Progress is much weaker than when looking at attainment (r squared values of <0.2 in most area types).
This is unsurprising, since how well pupils achieve at KS2 (which is taken into account in Progress 8), already depends a lot on their deprivation level.
However, in rural schools, we find that a moderate relationship returns. It therefore seems that low attainment in rural, high-deprivation secondary schools is not just about pupils having low starting points. Instead, there is an important link between school deprivation level and progress rates.
Why is pupil progress in disadvantaged secondary schools worse in rural schools than in other parts of the country? Click To Tweet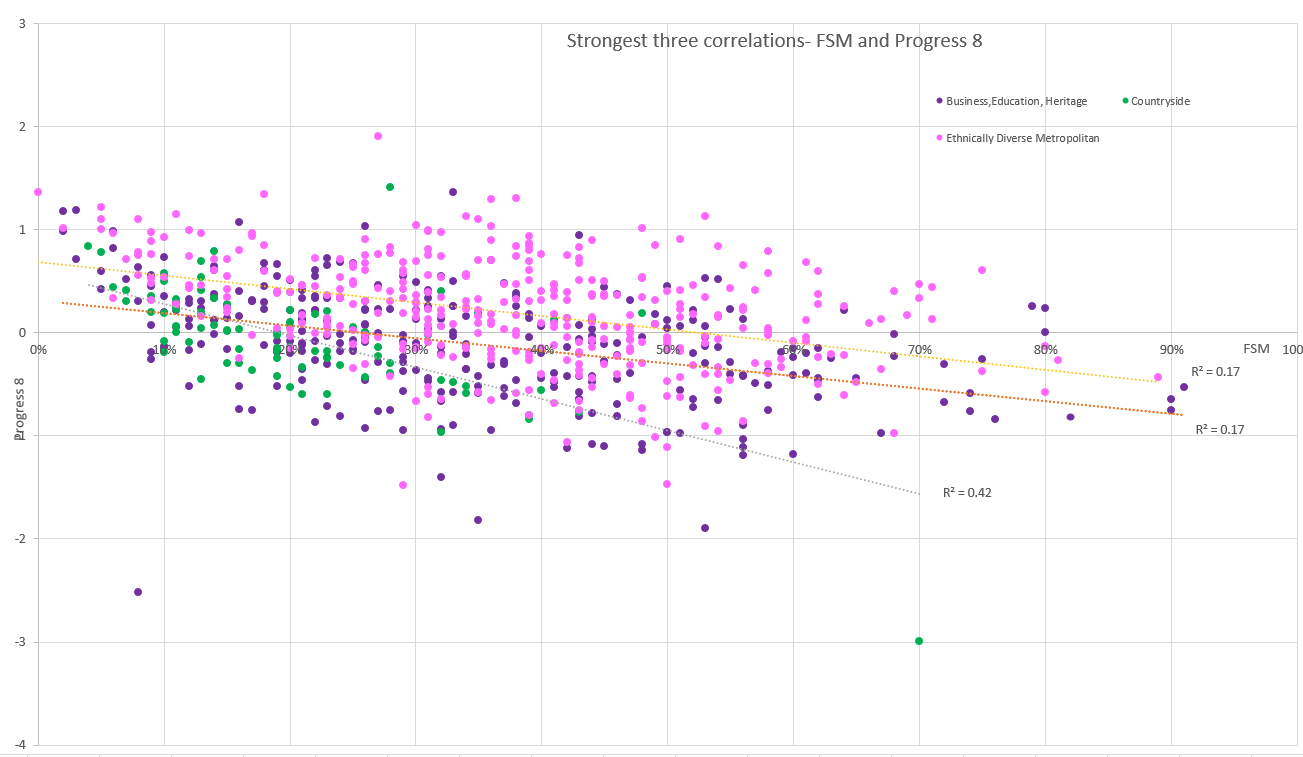
Implications
When considering how to break the link between poverty and education outcomes, it is crucial to take a nuanced view of poverty. Geography, demographics and community/economic context play a critical role in moderating the relationship between poverty and educational outcomes.
Geography, demographics and community/economic context play a critical role in moderating the relationship between poverty and educational outcomes. Click To TweetStudies of the factors affecting schools in different area types are therefore urgently needed, since these would help schools understand how best to respond to their circumstances.
Key factors to explore could include:
- Local labour markets and their history
- Attitudes to education linked to the above and to their contrasting ethnic make up.
- Proximity to other schools
- School size
- Teacher Labour market
- The range of, and actual wealth levels, both in the school and the community (FSM is a binary which hides huge variation in deprivation levels)
- The effect of school funding levels
Find out more about this analysis in Schools Week and read commments from Paul Luxmoore, the executive head of the Coastal Academies Trust.
Methodology notes
- Thank you to Alice Luetchford for support with analysis
- All data is from 2017-18
- Calculations are based on three fields in DfE data: “PTFSMCLA” (This refers to ever 6 FSM and Looked after children) and ATT8SCR (Average attainment 8 for the school) and P8MEA (Progress 8 measure after adjustment for extreme scores)
- Details of the area level classification can be found here: https://www.ons.gov.uk/methodology/geography/geographicalproducts/areaclassifications/2011areaclassification/abouttheareaclassifications
- Schools without available data were excluded from the analysis, as were special school where attainment, progress and deprivation follow different patterns. This means that since PTFSMCLA is supressed for schools with very low numbers of eligible pupils, schools with very low levels of disadvantage are not included in this analysis.
- Calculated averages are based on school rather than pupil level data
Comments