Show me the money: Was London’s success all about extra funding?
14th July 2014
In the second in our week of blogs picking apart ‘the London Story’ I explore the role of London’s funding advantage.
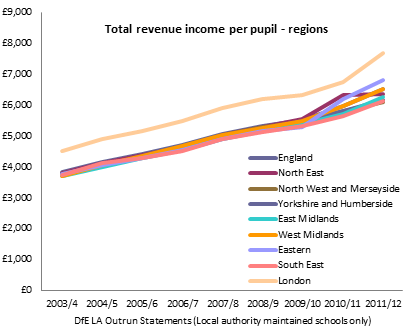
In 2010-11, average revenue income per pupil in London’s secondary schools was £7,687. In the rest of the South-East it was £6,125 (based on the DfE’s CFR LA outrun statements – which exclude academies). Is it therefore any surprise that the capital’s schools outperform those in neighbouring regions?
The evidence on the role of extra money in raising attainment is mixed: Gibbons et al. make use of the quirks in borough boundaries that lead to significant differences in the funding available to similar schools (for example between Haringey and Hackney) and show modest gains in pupil achievement in response to increases in funding. Levačić et al. reach a similar conclusion. On the other hand, Allen et al. summarise existing research by saying ‘the relationship between money and school quality has been shown to be weak’.
In my view, funding doesn’t explain London’s success but I still think money helped London’s schools in three important ways.
The main argument against the £s hypothesis is that the capital has enjoyed higher than average funding for a long time; if it were just thanks to money wouldn’t the capital have been well ahead for a long time? In reply it is argued that it’s the increases in funding that have made the difference – per pupil funding increased by an astonishing 71 percent in London between 2003/4 and 2011/12 (CFR LA outrun statements). However, funding actually increased by 69% nationally so this argument does not stand up either.
So what role did money play
1. It made higher pay possible:
In a 2012 blog Becky Allen argued that:
‘London schools receive about £1,000 more per secondary school pupil but most of it is simply used to pay teachers their estimated £5,000 wage premium… Once this greater wage bill is paid, London schools have very little left to spend on other resources that might contribute to their success.’
Allen is right – but there is a hidden point in what she says: London’s schools are able to pay this wage premium. If they didn’t have the extra money, they wouldn’t.The London Challenge team were keenly aware that teachers frequently left the city after a few years because they could not afford to live in London. This is why the London Pay Scale and Threshold were designed to hike wages up after a few years so as to improve the supply of more experienced teachers and middle/senior leaders.
Money in London has therefore been channeled towards overcoming a crucial barrier to success – the brain drain of teachers.
2. Deficits were dealt with
Over 50% of Local Authority schools in Westminster had a deficit in 2001-02 and the average size of deficit was over £400,000 – almost four times the national average. In London as a whole the average school deficit (for schools in deficit) was £181,129 compared to a national average of £107,664. Over the next decade, the average size of deficit dropped from 68 percent higher than the national average in 2001-02 to 13 percent higher in 2008-09.
Improving a school with a crippling deficit is a struggle- as deficits were alleviated, schools could concentrate on getting better.
There are a range of reasons why deficits dropped:
- In some cases it was because of better leadership
- In others, deficits were written off.
- In others, higher overall income made it easier to balance the budget
- In others, academisation allowed a fresh start.
London may have passed a funding threshold that enabled success.
3. Funding through vouchers
London Challenge’s approach to funding fell outside of the traditional dichotomy of ‘ring-fenced’ and ‘un-ringfenced’ funding: schools had to spend money on specific improvements but had autonomy in deciding how to spend it. The DCSF had a document outlining how funding decisions would be made; it emphasised the importance of allocating funding in response to specified priorities and for carefully planned solutions. A senior member of the London Challenge team explained that:
‘[schools] weren’t given money as some people think, to spend as they wanted: they were almost given a voucher… and the priorities were agreed between the adviser and the school, the School Improvement Board’
Funding was therefore used in a planned way that targeted improvement rather than being ‘lost in a general pot’. In order to access funding, schools put together a ‘Raising Achievement Plan’. This set out their school improvement priorities and how they would use funding to achieve them.
Speaking to interviewees I got the impression that the process of looking at data, setting priorities , planning spending and submitting this to external scrutiny in order to access funding was as important as the funding itself: it incentivised strategic leadership.
Funding in London helped address the supply of experienced teachers and leaders, moved the city above a threshold and helped focus schools’ on improvement. For this reason, I would agree with one Director of Children’s Services who argued that:
‘Funding was really important in the first phases, I think it is less of an issue now. But without it perhaps we wouldn’t be where we are now.’
More London Blogs:
- London Schools: Now we have a full(er) picture
- More than the sum of its parts: How London’s boroughs helped drive success
‘Lessons from London Schools: Investigating the Success’ is a Centre for London and CfBT report and we are grateful to both organisations for giving us the opportunity to carry out an in depth study of this crucial topic.
The views in this blog are my own and whilst my analysis is predominantly based on the CfL/CfBTreports, not all the data I have presented here is necessarily in the report.
Comments